
Paddock20 Telemetry · as of
One Model Y, measured.
Seven numbers from 44 days on the record: 39 driven, 3 rest days and 2 days from before the drive log began. Open one for the weeks behind it, then the days or chargers in a week, then the day or the charger’s week itself.
Miles, FSD (Supervised), efficiency, cost per mile and income count every day you pick. The billed rate and the charge loss come in whole weeks, so a range counts the weeks that fall inside it, and the tile says which.
- Billed rate39.5¢ a kWh$442.62 for 1,121 kWh from 30 invoices43.0¢ for each kWh that reached the battery, on 28 of 30 charges▼ down 0.4¢ from 39.9¢ on October 4measured
- Cost per mile12.9¢ a mile$442.62 charged for 3,427 milesincludes the energy lost in charging▼ down 0.2¢ from 13.1¢ on October 4measured
- Charge loss7.44%TezLab counted 993.6 of the 1,073.5 kWh billed into the battery2 charges held out, not counted▼ down 0.11 points from 7.55% on October 4measured
- Efficiency88% of rated100% is the rated figure; 3 of 39 driven days reached it▲ up 1 point from 87% on October 4measured
- Miles3,427mi403 drives across 39 driven days▲ up 265.3 mi from 3,161.4 mi on October 4measured
- On FSD (Supervised)94.5%3,238 of 3,427 miles▲ up 0.4 points from 94.1% on October 4measured
- Made with the car$902.12on 10 of 44 days$713.11 paid, $189.01 pending▲ up $115.26 from $786.86 on October 4measured
How each number is measured, and what it leaves out
- Billed rate
What it is. What the carmaker billed for each kWh it sent to the car, taken from the invoice. It is the price on the invoice, not the car’s estimate, and it is before any energy is lost on the way to the battery.
Why it moves. Some chargers bill a lower rate off-peak. The owner’s rate card, below, covers the two he uses most. A charger can change its price. A week’s figure is the average of that week’s invoices, so it moves with which chargers the car used and what they billed that week. The same numbers are also shown by place.
What it leaves out. Only charging invoices from August 25, the first day TezLab’s record covers, are counted: 3 invoices from before that (82.5 kWh, $38.36 billed) are in no figure here. Charging that cost nothing, like a free Level 2 plug, has no invoice. The Charge page also prints 41.7¢ (the same dollars over the 1,060 kWh that reached the battery, free plug included) and 43.1¢ (Supercharger kWh only); this figure divides by the kWh the carmaker billed. A charge is counted on the day it started and the cost per mile counts it on the day it ended, so at the edge of a range the two can differ by one charge.
The second figure. What each kWh that reached the battery cost, with the energy lost on the way paid for too. It counts only the charges both records saw, the same as the Charge page.
On-peak and off-peak. From the owner’s rate card, not from the carmaker’s invoices. An invoice carries the rate billed, not the hours it fell in, so a charge counts as on-peak or off-peak only when its billed rate equals one on the card. The owner puts off-peak overnight.
- Cost per mile
What it is. What the carmaker billed for charging, divided by the miles the car drove. It comes from the invoices, so it already includes the energy lost between the plug and the battery. Miles driven on free charging, like a Level 2 plug that costs nothing, are counted and add no dollars, which lowers the figure; about 3% of the energy, 33 kWh, was free.
Why it moves. A week’s figure divides the dollars on that week’s invoices by that week’s miles, and charging does not line up with driving: a charge on one day pays for miles on later days. It is the price paid for each kWh times the kWh used for each mile, so a higher rate, lower efficiency, more energy lost in charging or parking, or less free charging all raise it. The whole record is the steadier figure.
What it leaves out. Energy only. Insurance, the FSD (Supervised) subscription and Premium Connectivity are separate lines on the Ledger. Tires, registration and maintenance have no invoice in the Ledger yet, so none is priced.
- Charge loss
What it is. Energy the carmaker billed for that never reached the battery. The invoice counts what left the charger and TezLab counts what reached the battery; the gap is the loss. It is measured here, not explained: the two records say how large the gap is, not why.
Why it moves. A charge counts only when TezLab’s record covers at least 85% of the carmaker’s charging window. When TezLab starts late or stops early, the two records are not measuring the same energy, so the charge is held out of the number. Its price still counts in the billed rate.
What it leaves out. Charging that cost nothing, like a free Level 2 plug, has no invoice and so has no loss figure.
- Efficiency
What it is. How far the car goes on each kWh against the figure it is rated for: 100% is the rated figure. Each day is weighted by its miles, so a long day counts for more than a short one.
Why it moves. In general, speed, temperature, terrain and climate control move efficiency. This record measures the result for each day, not the reason.
- Miles
What it is. Every mile TezLab recorded the car driving, from August 25, for any purpose: deliveries, errands and the road trip.
What it leaves out. The 227 miles between delivery and TezLab’s first recorded drive, and 8 miles the log has not yet placed on a day. The odometer has moved 3,662 miles since delivery. A day the car did not move is a real zero: TezLab recorded no drive and the battery read the same before and after, with no charge between. August 23 and August 24 have no miles at all.
- On FSD (Supervised)
What it is. The share of miles driven with FSD (Supervised) engaged, counted from the drive log. It is driver assistance and needs an attentive driver for every mile, including a day at 100%.
- Made with the car
What it is. What the apps credited for work where the car was part of the job, from their own screens. Pending means the app has credited it and the cash has not yet been confirmed as received.
What it leaves out. The car’s costs and tax: it is what was credited, not profit. A day with no bar had no income logged: a day with nothing recorded, not a day that earned zero.
Measured from the car through TezLab, an app that records its drives and charges; from the carmaker’s charging invoices; and from the delivery apps’ own screens. Figures run through October 5, the last day TezLab has closed. Each small chart has one bar for every week (billed rate, cost per mile, charge loss) or day (the rest). A charge is called on-peak or off-peak only where its billed rate matches the owner’s rate card, marked stated. FSD (Supervised) needs an attentive driver for every mile. How each figure is measured.
One 2024 Model Y. 44 days on the record.
What one car makes
possible.
The Model Y isn’t the hero. What it lets you do is. FSD (Supervised) is driver assistance and needs an attentive driver for every mile. The hours between stops go to calls, code and deals with people who become clients.
44
Days on the record
94.5%
On FSD (Supervised)
3 jobs
One car, one day
12.9¢
Per mile, measured
Built by Paddock20
This is our capability.
From data collection to live updates: every number traced to an invoice or sensor. This garage app is built from the ground up to show what’s possible when software meets real-world economics. Built for transparency, optimized for scale.
Start where you are.
Every page is one question, answered from the same measured record.
 If you are weighing the switchThe SwitchGas to electric, in seven chapters.
 If you want to follow alongThe RecordLatest: October 5, 265 miles, 99% FSD (Supervised).
 If you are pricing oneThe Ledger12.9¢ a mile, measured against four gas vehicles.
 If you want the milesDrive3,427 miles, 94.5% of them on FSD (Supervised).
 If you are pricing a chargeCharge7.44% charge loss, across 28 invoices.
 If you are worried about the batteryBattery0% degradation at 114 cycles.
 If you are driving farRoad TripTwo states, four legs, five plugs.
 If you are hiringThe WorkOne car, three jobs.
 If you saw it workingThe ShiftOne delivery day, mile for mile.
 If you are running your ownYour NumbersThis car’s measured energy per mile, at your electricity rate.
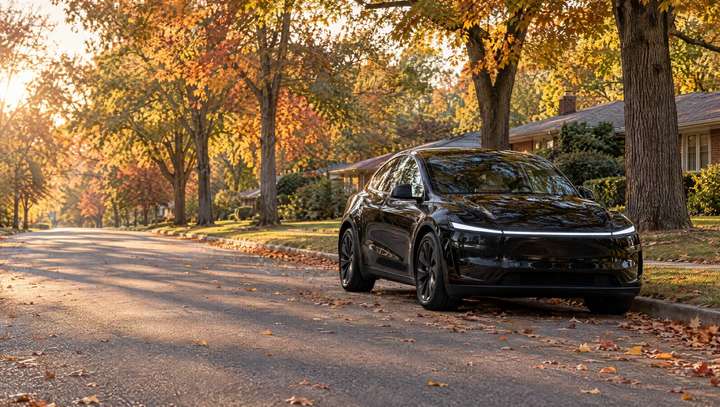
 If you want the specThe CarSolid Black, 2024 Model Y Long Range AWD.
 If you want to tune inField NotesLatest: Week of September 27, 377 miles, 87% FSD (Supervised).
 If you want the contextThe DriverThe context behind the car, and where the privacy line sits.
The Shift
Income stacking: three jobs, one car, one day.
Uber Eats and Instacart deliveries throughout the day, fridge stock orders for event rentals, software calls and client work. 94.5% of the car’s miles were on FSD (Supervised), which is driver assistance and needs an attentive driver for every mile. Three income streams, one car.
The cargo that pays.
Two full fridges of product, alcohol stock, and everything needed to outfit an Airbnb. The Model Y carries it organized in crates. The Lexus ES300h doesn’t. This is income: $25–50 per stop, stocking fridges for a Nashville vacation-rental concierge and amenities service, between Uber Eats and Instacart runs and calls.
Model Y (all seats folded): 76 cu ft. Lexus ES300h: 14 cu ft. Same driver, same roads, different payload. It enables work the sedan can’t touch.



The home charger math.
This record has no home charger in it, so the 12.9¢ a mile is priced at the 41.7¢ a kWh this car actually paid, mostly at public chargers. The owner’s own estimate for charging at home is $110 a month. Over the 1,962 miles a month this car is driving, that is 5.6¢ a mile.
The first bar is measured. The second is modeled: the owner's own estimate, not a bill, spread over this car’s own miles a month. The Lexus is modeled: 44 mpg at $3.64 a gallon (AAA Tennessee).
What the comparison leaves out is how the car is used: 94.5% of the miles were on FSD (Supervised), which needs an attentive driver.
Same driver, same roads, same pump.
The four vehicles below were actually owned and driven, not national averages for a car nobody has. Electricity is priced from the invoice, so it already includes the 7.44% that never reaches the battery.
Electric figure measured. Gas figures modeled: each vehicle's measured fuel economy at $3.64 a gallon (AAA Tennessee, 2026-08-24). The difference is 15.1¢ on every mile driven.
Where it actually goes.
403 drives, 3,426.7 miles, aggregated to city level on purpose.
measured. Line weight is trip count, orange rings mark places it has charged. Per drive coordinates and departure times are held back: the clusters resolve to a home and a workplace.
The rule this runs on
A number here is measured from an invoice, an app screen or a sensor, modeled from a derivation, or stated by the owner, and says which. The build fails rather than publish a figure that cannot be sourced. That rule is why the unflattering numbers, depreciation, charge loss, cold range, are still on the page.
Follow the miles
Every week’s miles, charging and cost per mile, straight from the car, in the feed.