Paddock20 Telemetry · as of

One Model Y, measured.

Seven numbers from 44 days on the record: 39 driven, 3 rest days and 2 days from before the drive log began. Open one for the weeks behind it, then the days or chargers in a week, then the day or the charger’s week itself.

How each number is measured, and what it leaves out
Billed rate

What it is. What the carmaker billed for each kWh it sent to the car, taken from the invoice. It is the price on the invoice, not the car’s estimate, and it is before any energy is lost on the way to the battery.

Why it moves. Some chargers bill a lower rate off-peak. The owner’s rate card, below, covers the two he uses most. A charger can change its price. A week’s figure is the average of that week’s invoices, so it moves with which chargers the car used and what they billed that week. The same numbers are also shown by place.

What it leaves out. Only charging invoices from August 25, the first day TezLab’s record covers, are counted: 3 invoices from before that (82.5 kWh, $38.36 billed) are in no figure here. Charging that cost nothing, like a free Level 2 plug, has no invoice. The Charge page also prints 41.7¢ (the same dollars over the 1,060 kWh that reached the battery, free plug included) and 43.1¢ (Supercharger kWh only); this figure divides by the kWh the carmaker billed. A charge is counted on the day it started and the cost per mile counts it on the day it ended, so at the edge of a range the two can differ by one charge.

The second figure. What each kWh that reached the battery cost, with the energy lost on the way paid for too. It counts only the charges both records saw, the same as the Charge page.

On-peak and off-peak. From the owner’s rate card, not from the carmaker’s invoices. An invoice carries the rate billed, not the hours it fell in, so a charge counts as on-peak or off-peak only when its billed rate equals one on the card. The owner puts off-peak overnight.

Cost per mile

What it is. What the carmaker billed for charging, divided by the miles the car drove. It comes from the invoices, so it already includes the energy lost between the plug and the battery. Miles driven on free charging, like a Level 2 plug that costs nothing, are counted and add no dollars, which lowers the figure; about 3% of the energy, 33 kWh, was free.

Why it moves. A week’s figure divides the dollars on that week’s invoices by that week’s miles, and charging does not line up with driving: a charge on one day pays for miles on later days. It is the price paid for each kWh times the kWh used for each mile, so a higher rate, lower efficiency, more energy lost in charging or parking, or less free charging all raise it. The whole record is the steadier figure.

What it leaves out. Energy only. Insurance, the FSD (Supervised) subscription and Premium Connectivity are separate lines on the Ledger. Tires, registration and maintenance have no invoice in the Ledger yet, so none is priced.

Charge loss

What it is. Energy the carmaker billed for that never reached the battery. The invoice counts what left the charger and TezLab counts what reached the battery; the gap is the loss. It is measured here, not explained: the two records say how large the gap is, not why.

Why it moves. A charge counts only when TezLab’s record covers at least 85% of the carmaker’s charging window. When TezLab starts late or stops early, the two records are not measuring the same energy, so the charge is held out of the number. Its price still counts in the billed rate.

What it leaves out. Charging that cost nothing, like a free Level 2 plug, has no invoice and so has no loss figure.

Efficiency

What it is. How far the car goes on each kWh against the figure it is rated for: 100% is the rated figure. Each day is weighted by its miles, so a long day counts for more than a short one.

Why it moves. In general, speed, temperature, terrain and climate control move efficiency. This record measures the result for each day, not the reason.

Miles

What it is. Every mile TezLab recorded the car driving, from August 25, for any purpose: deliveries, errands and the road trip.

What it leaves out. The 227 miles between delivery and TezLab’s first recorded drive, and 8 miles the log has not yet placed on a day. The odometer has moved 3,662 miles since delivery. A day the car did not move is a real zero: TezLab recorded no drive and the battery read the same before and after, with no charge between. August 23 and August 24 have no miles at all.

On FSD (Supervised)

What it is. The share of miles driven with FSD (Supervised) engaged, counted from the drive log. It is driver assistance and needs an attentive driver for every mile, including a day at 100%.

Made with the car

What it is. What the apps credited for work where the car was part of the job, from their own screens. Pending means the app has credited it and the cash has not yet been confirmed as received.

What it leaves out. The car’s costs and tax: it is what was credited, not profit. A day with no bar had no income logged: a day with nothing recorded, not a day that earned zero.

Measured from the car through TezLab, an app that records its drives and charges; from the carmaker’s charging invoices; and from the delivery apps’ own screens. Figures run through October 5, the last day TezLab has closed. Each small chart has one bar for every week (billed rate, cost per mile, charge loss) or day (the rest). A charge is called on-peak or off-peak only where its billed rate matches the owner’s rate card, marked stated. FSD (Supervised) needs an attentive driver for every mile. How each figure is measured.

One 2024 Model Y. 44 days on the record.

What one car makes
possible.

The Model Y isn’t the hero. What it lets you do is. FSD (Supervised) is driver assistance and needs an attentive driver for every mile. The hours between stops go to calls, code and deals with people who become clients.

Why this exists

A software studio, built in daylight.

One way to build something of your own is nights and weekends, around a job. I chose the other way: delivery blocks on my own schedule, then software, events and clients in the hours between, with the car and the numbers on a public record.

Paddock20 is a software studio. The Test Track is its proving ground, and Case 01 is one 2024 Model Y, with its drives, charges and income written up day by day, each figure on those pages labeled measured, modeled or stated.

  • 44days on the record
  • 3,427miles driven
  • 94.5%of miles on FSD (Supervised)
  • 12.9¢a mile for energy, measured

The data

Three questions. One car. 44 days.

Income, worked out

On the apps' clock, this car's delivery days pay about like a $56K job.

Net dollars for each hour, after payroll tax and the car's running costs, before income tax. The job counts every hour it takes: 50 hours a week on site and a daily commute of 80 miles. This car's delivery hours are the apps' own clock, which leaves out the waiting between orders, so its bar reads high. The $25 an hour target would pay about like a $61K job.

Net dollars an hour

  1. W-2 job at $90,000Modeled$26.66 an hour
  2. W-2 job at $75,000Modeled$21.96 an hour
  3. Target: $25 an hourTarget$17.42 an hour
  4. W-2 job at $60,000Modeled$17.25 an hour
  5. This car, from its measured days7 delivery days, 21 app hoursModeled$15.97 an hourThe line marks the best and worst day: $11.83–$21.48
  6. Uber Eats, top 10% of Gridwise driversGridwise 2025 pay, this car's costsModeled$15.07 an hour
  7. W-2 job at $50,000Modeled$14.12 an hour
  8. Instacart, median Gridwise shopperGridwise 2025 pay, this car's costsModeled$9.63 an hour
  9. Uber Eats, median Gridwise driverGridwise 2025 pay, this car's costsModeled$9.27 an hour

This car's bar pools 7 of the Record's 10 delivery days, the ones with the car's own miles, and the line marks its best and worst day. The Gridwise bars rest on Gridwise's 2025 driver data (101,709 Uber Eats drivers, 20,538 Instacart shoppers) and a pace it does not publish, so read them as a scale, not a measurement. The job is an example, and so are its pay levels. These are this car's days, not an average and not a promise to anyone. Every bar is modeled.

How each bar is worked out

Delivery: pay an hour, less the miles an hour at 23.1¢ a mile, then less self-employment tax of 14.13% of what is left. The job: pay less payroll tax of 7.65%, less 20,000 commute miles a year at 23.1¢, over 2,944 hours a year: 50 hours a week on site and 8.9 hours driving (80 miles a day at an assumed 45 miles an hour), for 50 weeks.

BarPay an hourMiles an hourNet an hour
This car, Uber Eats, 4 days$24.5525.5$16.03
This car, Instacart, 3 days$20.277.9$15.84
This car, all 7 days (its bar)$23.3120.4$15.97
Gridwise, Uber Eats, top 10% of Gridwise drivers$20.8314.2$15.07
Gridwise, Uber Eats, median Gridwise driver$14.0714.2$9.27
Gridwise, Instacart, median Gridwise shopper$12.214.3$9.63
The target$25.0020.4$17.42

23.1¢ a mile is the Ledger's running cost at this car's pace: energy, insurance, FSD (Supervised) and connectivity. Tires, registration, maintenance and depreciation are not in it, because the Ledger prices only what it has an invoice for. Each 10 cents a mile more would take about $1.75 an hour off this car's bar and about 68 cents off a job's, which lowers the headline by about $3K.

App hours are what the app itself counted: Instacart's active clock, and for Uber Eats each delivery's own minutes added up, so two orders made together are each counted in full. This car's bar uses the 7 of the Record's 10 delivery days that have the car's own miles in the shift, over the same lines' app hours. Bonus lines have no app hours and are left out ($150.00 on 1 line), as trip pay leaves promotions out; 2 lines are still pending ($189.01) and count, as they do on the Record.

Gridwise's pay is for 2025: 101,709 Uber Eats drivers (page dated September 8, 2026) and 20,538 Instacart shoppers (page dated April 1, 2026). The median bars are trip pay with tips, before promotions and before vehicle costs, and the top-10% bar is the pay the top tenth of drivers reach or pass. Its pages call the hour a work hour and do not say whether waiting is in it, and they give no miles an hour, so each of its bars takes the pace its own pay a mile implies, 14.2 on Uber Eats and 4.3 on Instacart, and charges this car's cost a mile; a driver's own car could cost more or less. Those paces are rough: at 18 miles an hour the Uber Eats median bar would be $8.52 and at 10 it would be $10.10, so the order of the two lowest bars is not firm. Each mile an hour more or less moves a delivery bar by about 20¢ an hour. On the one day the Record has start to finish, the app counted 4.1 of 5.3 hours on shift, 30 minutes of the gap a charging stop, so counting every hour the way the job does would lower that day's net by about 23%. How much waiting the other days hold is not measured.

Left out: income tax, which applies to both; the job's benefits, which would raise its bars; and the IRS mileage rate, which deducts more per mile than the car costs and would lower delivery's tax a little. The 45 miles an hour and the 50 weeks are assumptions.

Sources: Gridwise on Uber Eats and Gridwise on Instacart.

Who this is for

Pick the one that sounds like you.

  • I run a business with vans or a fleetA vehicle's cost per mile, receipt by receipt. Paddock20 builds software for service businesses.Book a Fit Call
  • I'm deciding on an EVA charging bill, a battery reading and a cost per mile, from one car.Run your numbers
  • I drive gigsThinking about a Model Y for delivery work? One driver's pay and miles, day by day, beside the car's own numbers.Open the Record
  • I serve EV owners, back events or host a showTell me what you would want measured: detailing, chargers, insurance, accessories, events, a show.Say hello
  • I'm following along, or I know someone who should see thisA page for every week, built from the car's own numbers, and a feed to follow it.Read Field Notes

How it stays honest

Measured, modeled or stated.

Measured
From the car, a document or an app's own screen.
Modeled
Worked out from measured figures, and the page says how.
Stated
My word, with no document behind it.

FSD (Supervised) is driver assistance and needs an attentive driver. What does not flatter stays in: this car returns 76% of its rated efficiency, 9 points under the 85% average of 20 Model Ys nearby. A figure that changes later carries a dated correction. If a company gives me something to use, or a link pays me, the page says so beside it. Sources include the carmaker's invoices and TezLab.

An independent record kept by Paddock20. Not affiliated with, endorsed by or sponsored by the carmaker, TezLab, Uber, Instacart or Gridwise. Product names are their owners' marks.

Work with Paddock20

Talk to the builder.

Paddock20 is built for service businesses outgrowing their software. A Fit Call is 60 to 90 minutes with the builder, and you leave with a written build order: what we'd build, what it costs, how long it takes. Yours to keep either way.

Hosting a podcast, running an event or making something for EV owners? Say hello and tell me what you have in mind.

Ready to talk now? Book a Fit Call.

Built by Paddock20

This is our capability.

From data collection to live updates: every number traced to an invoice or sensor. The Test Track is built from the ground up to show what’s possible when software meets real-world economics. Built for transparency, optimized for scale.

Explore Paddock20

Start where you are.

Every page is one question, answered from the same measured record.

The Shift

Income stacking: three jobs, one car, one day.

Uber Eats and Instacart deliveries throughout the day, fridge stock orders for event rentals, software calls and client work. 94.5% of the car’s miles were on FSD (Supervised), which is driver assistance and needs an attentive driver for every mile. Three income streams, one car.

Read the breakdown →

The cargo that pays.

Two full fridges of product, alcohol stock, and everything needed to outfit an Airbnb. The Model Y carries it organized in crates. The Lexus ES300h doesn’t. This is income: $25–50 per stop, stocking fridges for a Nashville vacation-rental concierge and amenities service, between Uber Eats and Instacart runs and calls.

Model Y (all seats folded): 76 cu ft. Lexus ES300h: 14 cu ft. Same driver, same roads, different payload. It enables work the sedan can’t touch.

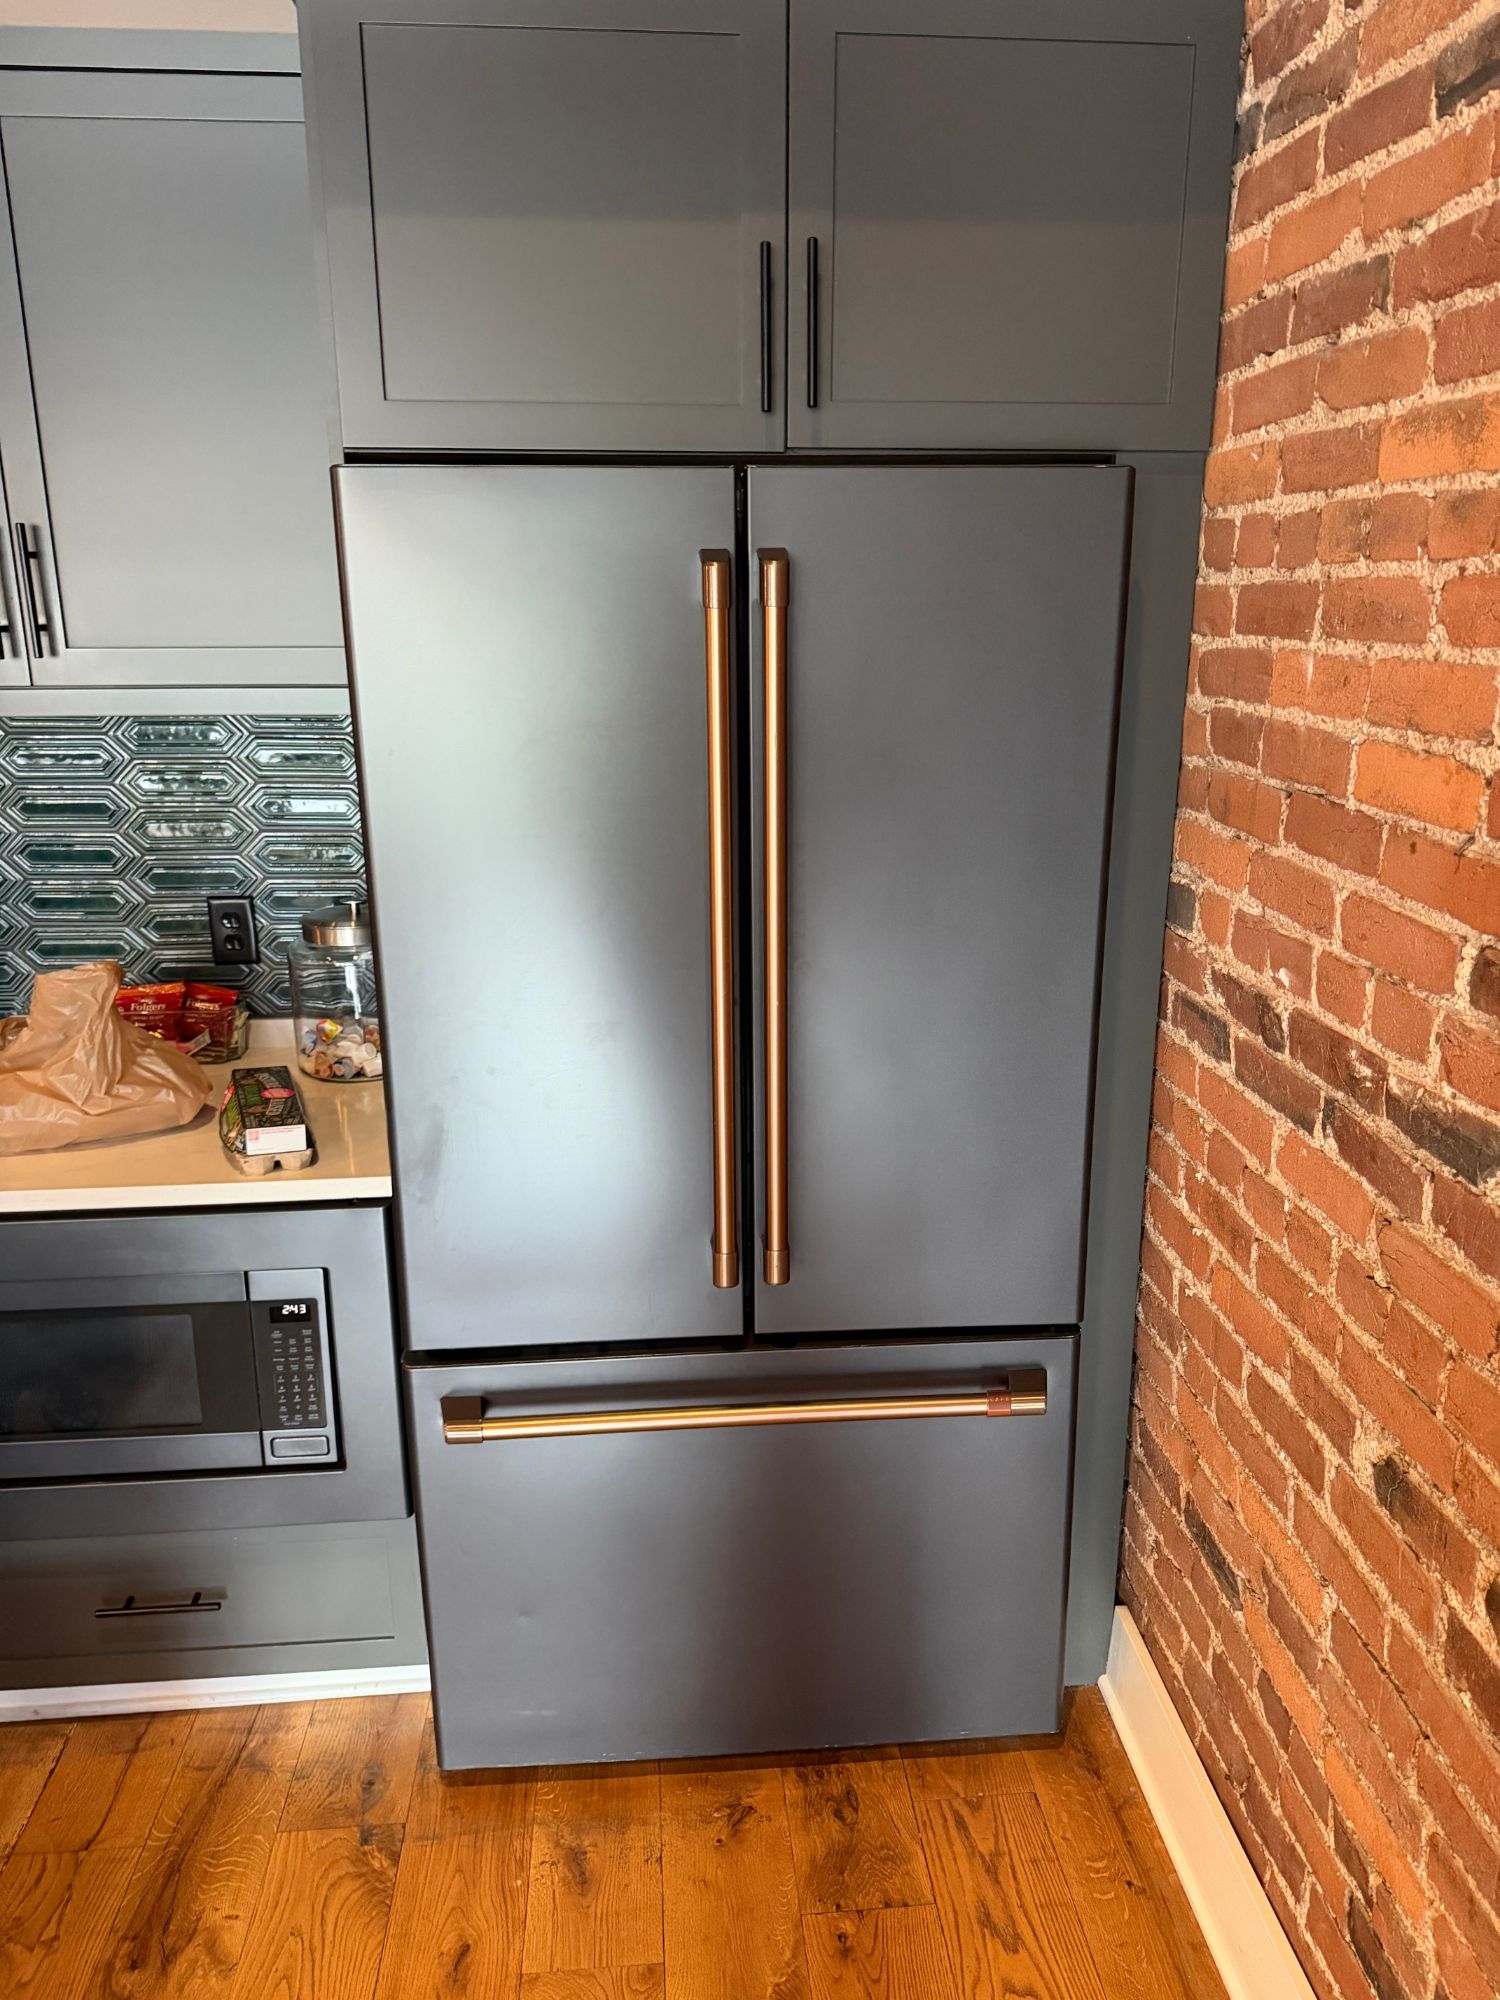
High-end refrigerator stocked with organized beverages, condiments, and prepared items
Staged inventory: wines, juices, condiments ready for concierge stops at $25–50 each
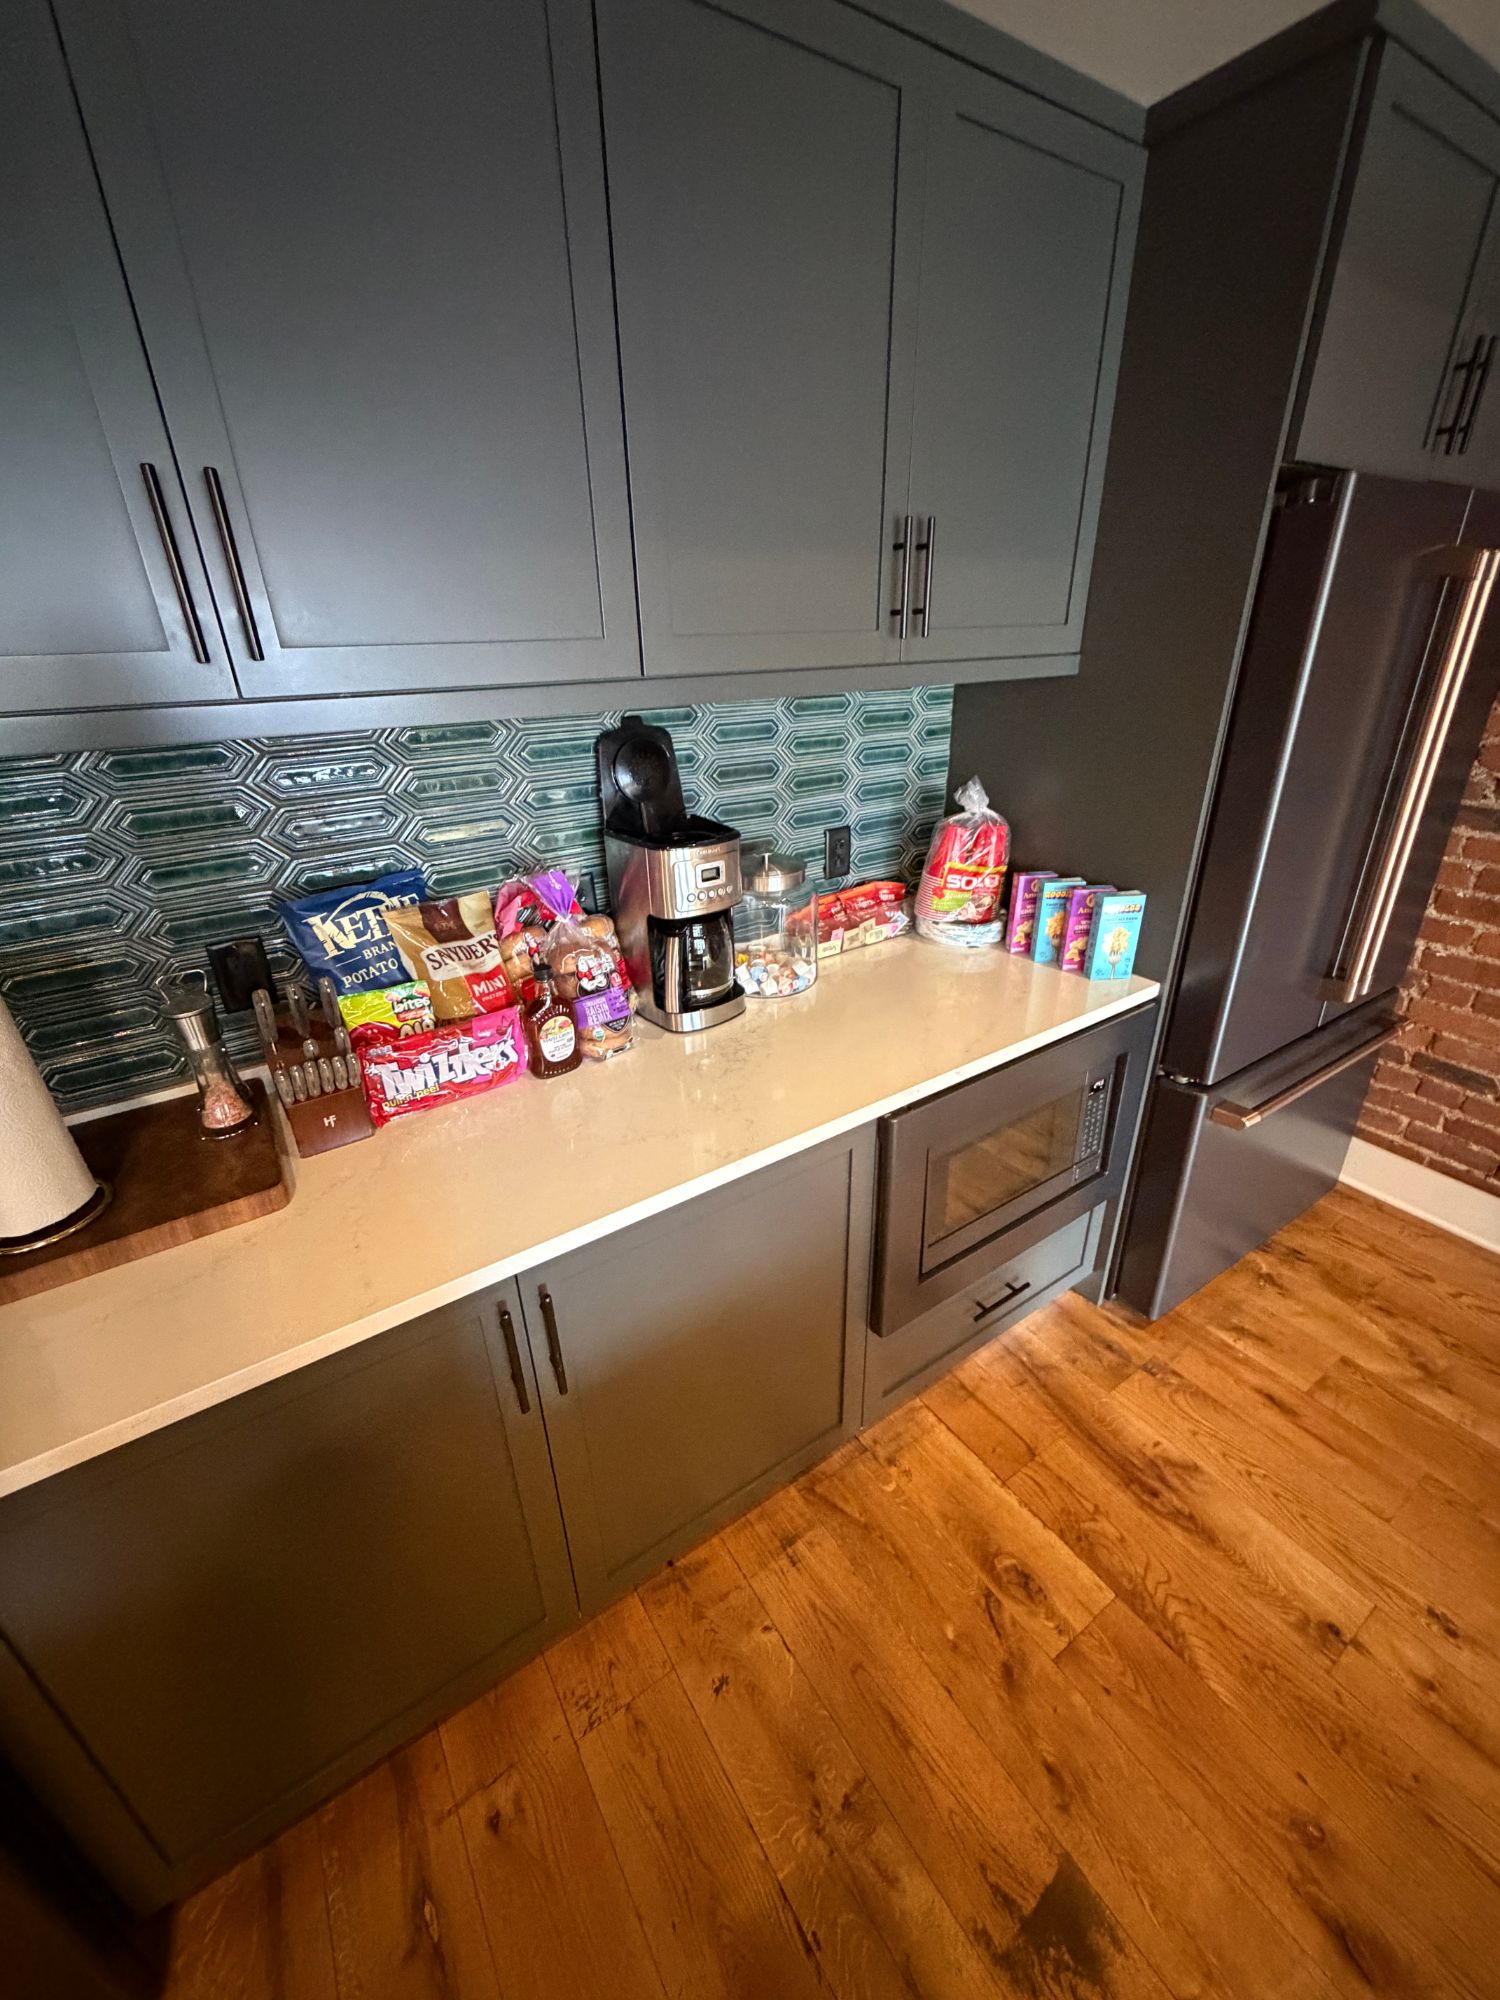
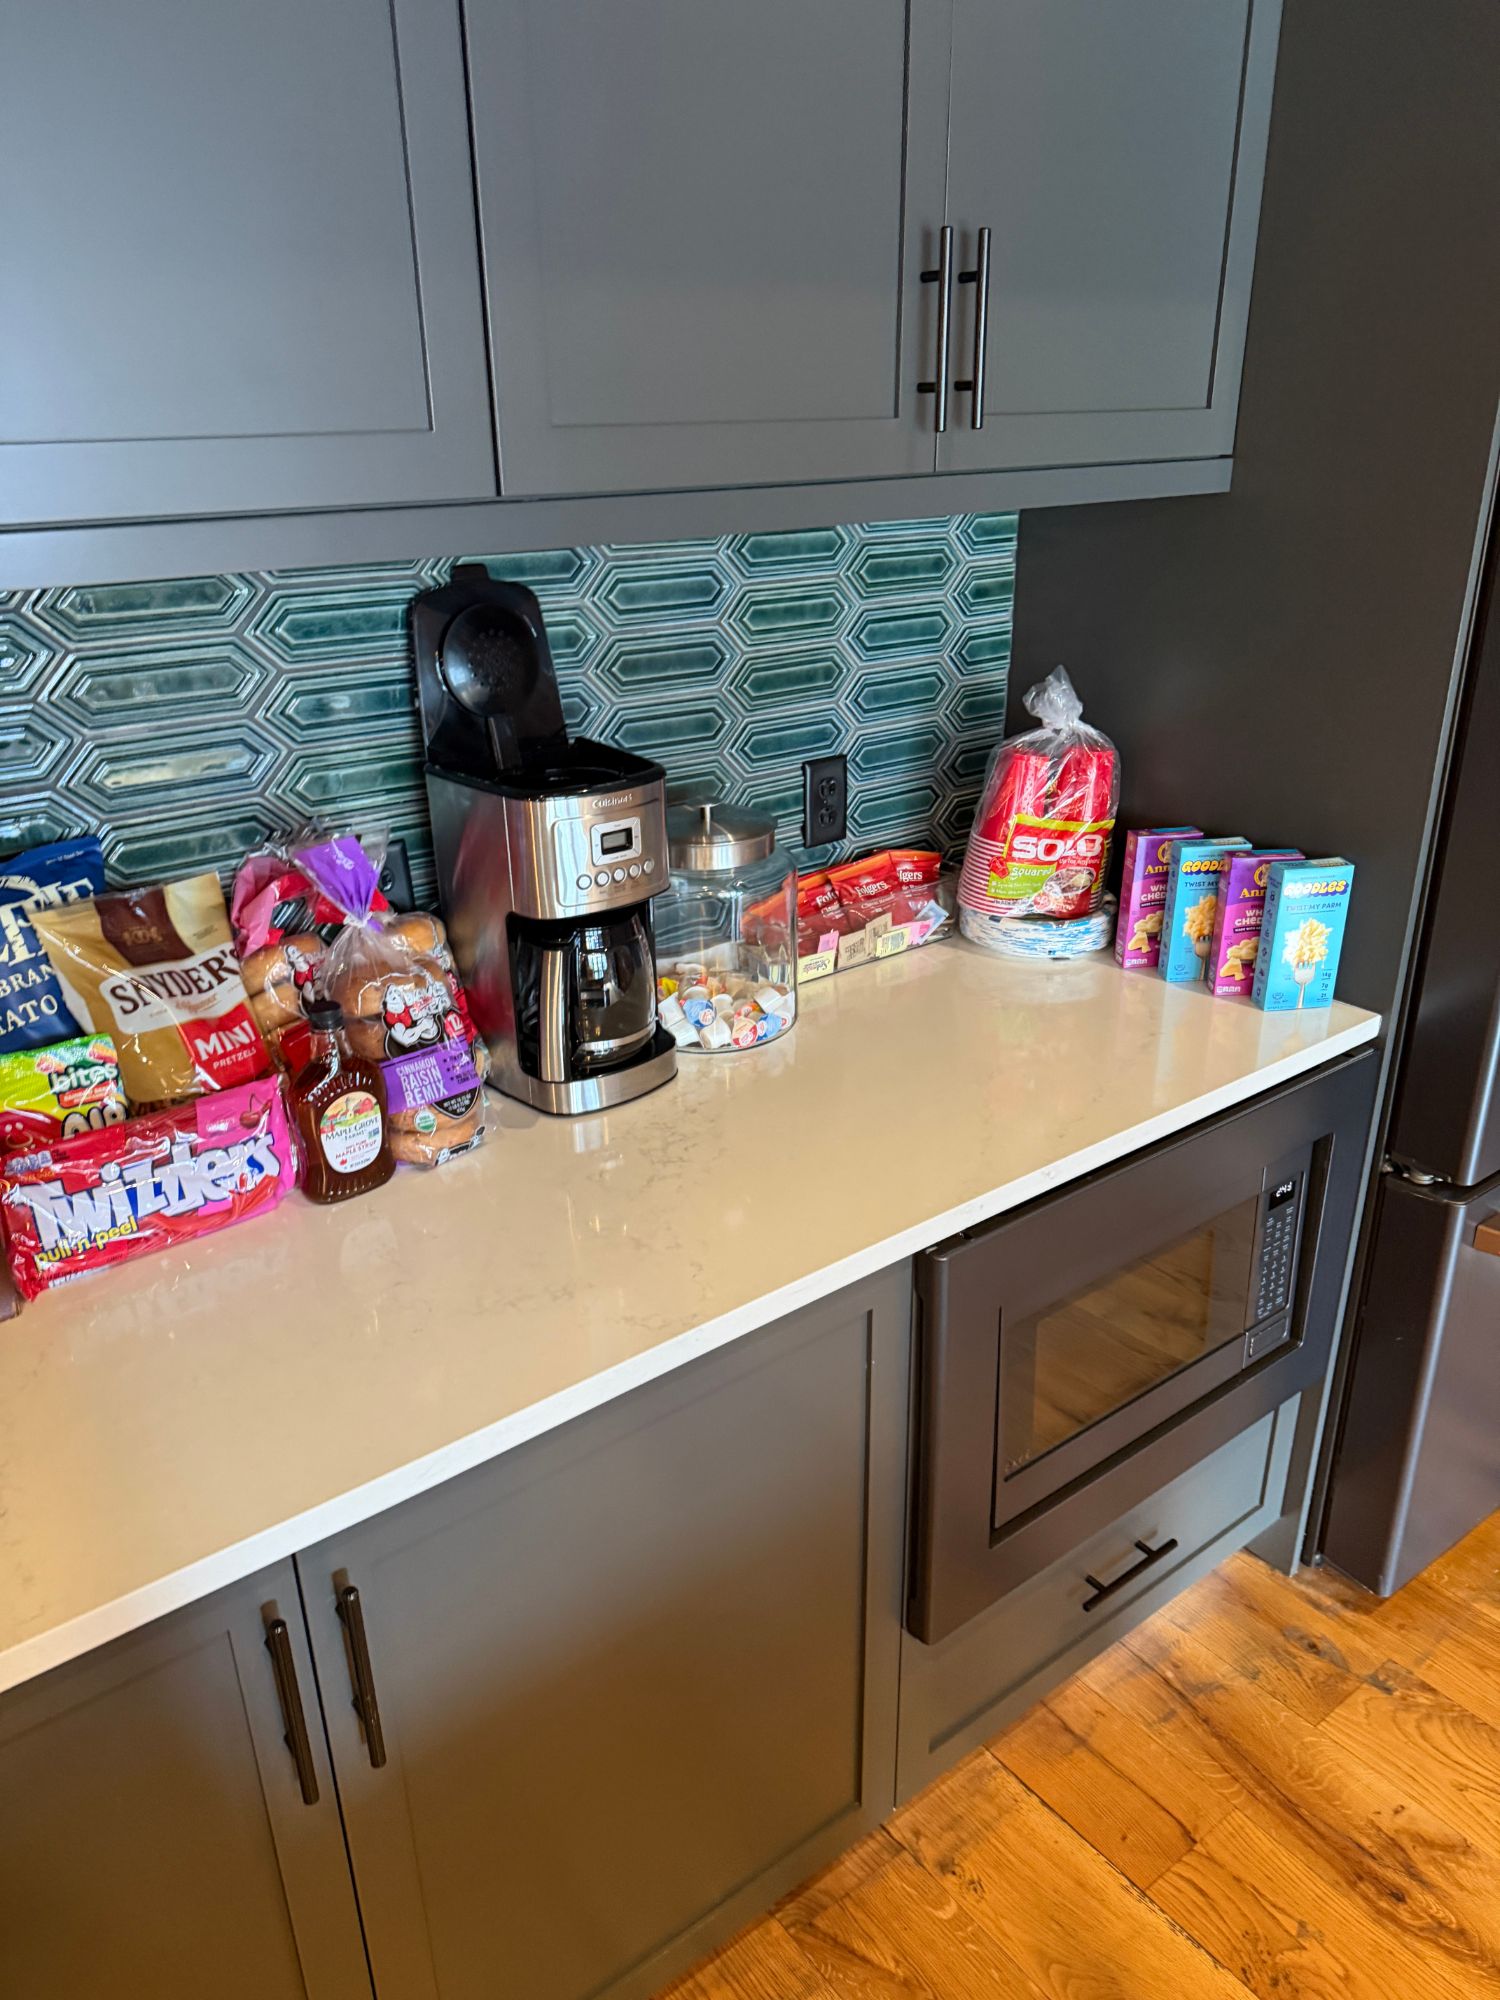
Kitchen counter with organized Rosong carts, snacks, and delivery staging
Packing hub: orders sorted by delivery, carts staged for quick loading
Modern kitchen island with pendant lighting, counter workspace, and organization
Coordination point: voice prompts from Claude, Uber app notifications, real-time staging

The home charger math.

This record has no home charger in it, so the 12.9¢ a mile is priced at the 41.7¢ a kWh this car actually paid, mostly at public chargers. The owner’s own estimate for charging at home is $110 a month. Over the 1,962 miles a month this car is driving, that is 5.6¢ a mile.

This car, as chargedThis car, as charged: 12.9¢/mi measured12.9¢/miThis car, home powerThis car, home power: 5.6¢/mi modeled5.6¢/miLexus ES300hLexus ES300h: 8.3¢/mi 44 mpg8.3¢/mi

The first bar is measured. The second is modeled: the owner's own estimate, not a bill, spread over this car’s own miles a month. The Lexus is modeled: 44 mpg at $3.64 a gallon (AAA Tennessee).

What the comparison leaves out is how the car is used: 94.5% of the miles were on FSD (Supervised), which needs an attentive driver.

Same driver, same roads, same pump.

The four vehicles below were actually owned and driven, not national averages for a car nobody has. Electricity is priced from the invoice, so it already includes the 7.44% that never reaches the battery.

2024 Model Y (this car)2024 Model Y (this car): 12.9¢/mi measured12.9¢/mi2015 Chevrolet Express 25002015 Chevrolet Express 2500: 28.0¢/mi 13 mpg28.0¢/mi2016 Toyota Sequoia Platinum 2WD2016 Toyota Sequoia Platinum 2WD: 24.3¢/mi 15 mpg24.3¢/mi2011 Toyota Sienna Limited2011 Toyota Sienna Limited: 18.2¢/mi 20 mpg18.2¢/miLexus ES300hLexus ES300h: 8.3¢/mi 44 mpg8.3¢/mi

Electric figure measured. Gas figures modeled: each vehicle's measured fuel economy at $3.64 a gallon (AAA Tennessee, 2026-08-24). The difference is 15.1¢ on every mile driven.

Where it actually goes.

403 drives, 3,426.7 miles, aggregated to city level on purpose.

Murfreesboro to Unionville: 1 trips, 27.4 miLebanon to Smyrna: 1 trips, 33.1 miEagleville to Lebanon: 1 trips, 45.9 miEagleville to Unionville: 1 trips, 7.8 miFranklin to Unionville: 2 trips, 58.1 miBrentwood to Unionville: 3 trips, 99.6 miLebanon to Nashville: 4 trips, 104.4 miFranklin to Lebanon: 5 trips, 210.7 miFranklin to Nashville: 6 trips, 108.4 miBrentwood to Lebanon: 8 trips, 333.2 miBrentwood to Nashville: 36 trips, 502.1 miBrentwood to Franklin: 104 trips, 380.9 miBrentwood: 153 tripsBrentwoodEagleville: 2 tripsEaglevilleFranklin: 117 tripsFranklinLebanon: 19 tripsLebanonMurfreesboro: 1 tripsMurfreesboroNashville: 46 tripsNashvilleSmyrna: 1 tripsSmyrnaUnionville: 7 tripsUnionville

measured. Line weight is trip count, orange rings mark places it has charged. Per drive coordinates and departure times are held back: the clusters resolve to a home and a workplace.

Odometer 22,918.1 mi Per mile 12.9¢ Degradation 0% On FSD (Supervised) 94.5% Snapshot 2026-10-06, baked at deploy. This page makes no live requests.

The rule this runs on

A number here is measured from an invoice, an app screen or a sensor, modeled from a derivation, or stated by the owner, and says which. The build fails rather than publish a figure that cannot be sourced. That rule is why the unflattering numbers, depreciation, charge loss, cold range, are still on the page.

measured invoice or sensor modeled derived, and says so Pulled 2026-10-06 · VIN serial masked · no addresses

Follow the miles

Every week’s miles, charging and cost per mile, straight from the car, in the feed.